


“Be aware that the market does not turn when it sees light at the end of the tunnel. It turns when all looks black, but just a subtle shade less black than the day before.” – James Montier
Why must we view them differently?
The stock market is frequently taken for a real-time analog to the economy. Too often the two are compared in ways that make them appear similar. It may surprise you to learn that this is simply not the case.
It is perfectly understandable why the two are often conflated, considering the interchangeable way many politicians and pundits discuss them. But understanding the difference between the two is important if we are to understand our own financial outlook better.
The stock market
A stock is a fractional share of a business. When you own a stock, you own a fractional share of a business—the stock’s price is the business’ agreed upon selling price. The stock market is a collection of exchanges through which investors ultimately buy and sell fractional shares of these underlying businesses.
The economy
Gross Domestic Product (“GDP”) is the total value of goods and services produced in a country over the course of a given year. GDP is a prominent measurement of the economy.
The key differences
Even with laid out definitions, it is still easy to assume that the economy and the stock market would naturally move in lockstep. In practice, however, they do not. Here’s why:
- First, the stock market is inhabited mostly by large corporations, neglecting the smaller companies that contribute nearly half of U.S. economic activity.
- Second, the stock market does not represent all participants within an economy.
- Finally (and most importantly), economic data is meant to reflect the present while the price of a stock is meant to reflect the aggregated investors’ expectations of the future of a company.
The fascinating relationship
However, all of this is not to say that stocks are completely disconnected from the economy, far from it. They are still related. In fact, a 1990 article published in the prestigious Journal of Finance[i] found using over a century of evidence that stock market movements actually have a statistically robust relationship with economic growth and decline—but that relationship was significant with future economic growth, not current economic growth. And SYM’s own internal research has found this relationship still holds true today with more recent anecdotes.
Now, it is all well and good that the most widely cited academic journal in finance published an article which identified a statistically significant relationship between stock market movement and future economic growth—but what is the underlying intuition that underpins that relationship?
People often obsess over the most recent releases of economic data, and then go on to assume that these measures (such as the most recent quarterly GDP growth estimates) will guide near-term stock market performance. Unfortunately, we believe that approach often leads to disappointing results. Remember, a company’s stock price is meant to reflect forward looking estimates of profit growth or decline. Because of this basic relationship, stocks have often already fallen to account for (or ‘price in’) a souring economy by the time the economic data is released, or the news picks it up and reports it. The reverse is also true: by the time growing whispers of an economic recovery are vindicated by official announcements, stock prices have often already rallied. This observed phenomenon would prove quite frustrating (and costly) to the investor attempting to time their stock ownership based on the direction of the current economic wind. Even if an investor was blessed with the ability to identify the economy’s peaks and troughs in real time, they would sadly still be selling low and buying high to get reinvested quite often.
Confusing the two
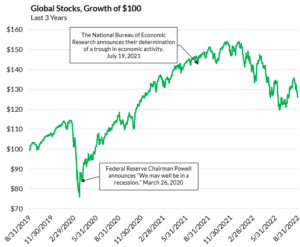
The most recent example of this phenomenon was the Covid-19 recession. The chart below shows the investment growth of $100 invested in global stocks (as represented by the MSCI ACWI NR Index) over the last three years ending August 31, 2022. If you were to sell based on the highlighted recession headlines from Fed Chairman Powell and the National Bureau of Economic Research, it would have resulted in selling your original $100 investment for $75 in March of 2020 and reinvesting in July of 2021—by which time your original $100 investment would have grown to $143, had you not sold in 2020.
The stock market can help predict economic growth or contraction, but conversely, economic growth is a poor predictor of the stock market. In the anecdote above, the stock market declined, and sure enough, a recession subsequently unfolded. Unfortunately, many investors invert the two and suffer the consequences by selling in reaction to grim economic news. Stocks are often valued lower in that environment. Selling low and buying high is no way to win in the market.
Constructing a stock portfolio
At SYM, we prefer to construct our stock portfolio with an eye for the long-term and set your asset allocation by only investing funds you won’t need for a long time into the stock market. While financial media is happy to bombard viewers with sensational economic headlines, we aim to highlight the data. And solid intuition behind that data suggests that these headlines will often have a counterintuitive relationship to stock returns. We do not suggest deciding whether you’re invested in the market on this basis. While there is a place for considering economic data in your investment portfolio, it is important to us at SYM that economic data is considered within a larger underlying framework of empirically supported intuitions.
[i] Stock Returns and Real Activity: A Century of Evidence – SCHWERT – 1990 – The Journal of Finance – Wiley Online Library
https://www.forbes.com/sites/forbesbusinesscouncil/2022/03/25/how-small-businesses-drive-the-american-economy/?sh=4aefd5724169
https://www.morningstar.com/articles/1034789/short-answer-stock-market-vs-economy